Mid-week market update: It's always nice to take a few days off during the holidays, except all that I got for Christmas was a cold. The stock market doesn't seem to be doing too much better as it tests the bottom of a narrow trading range during what should be a period of positive seasonality.
None of the other major indices, such as the DJIA, NASDAQ, or Russell 2000, have broken support. The one exception is the Dow Jones Transports.
My inner trader has a number of tactical concerns as we look ahead into January.
Preface: Explaining our market timing models
We maintain several market timing models, each with differing time horizons. The "Ultimate Market Timing Model" is a long-term market timing model based on the research outlined in our post, Building the ultimate market timing model. This model tends to generate only a handful of signals each decade.
The Trend Model is an asset allocation model which applies trend following principles based on the inputs of global stock and commodity price. This model has a shorter time horizon and tends to turn over about 4-6 times a year. In essence, it seeks to answer the question, "Is the trend in the global economy expansion (bullish) or contraction (bearish)?"
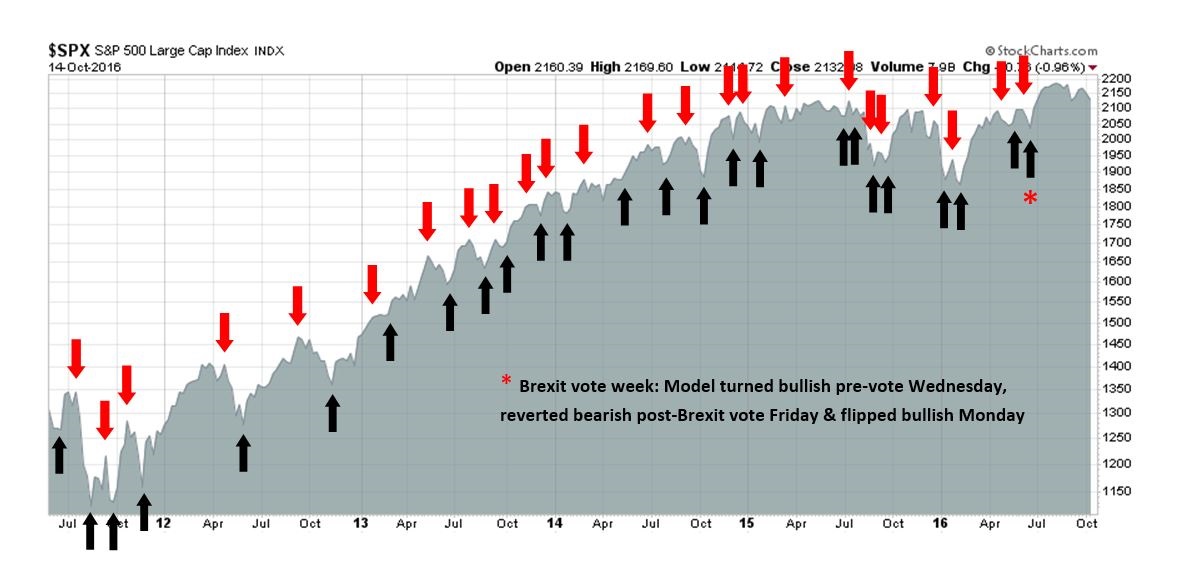
My inner trader uses the trading component of the Trend Model to look for changes in direction of the main Trend Model signal. A bullish Trend Model signal that gets less bullish is a trading "sell" signal. Conversely, a bearish Trend Model signal that gets less bearish is a trading "buy" signal. The history of actual out-of-sample (not backtested) signals of the trading model are shown by the arrows in the chart below. Past trading of the trading model has shown turnover rates of about 200% per month.
The latest signals of each model are as follows:
Ultimate market timing model: Buy equities*
Trend Model signal: Risk-on*
Trading model: Bullish*
The performance chart and model readings have been delayed by a week out of respect to our paying subscribers.
Update schedule: I generally update model readings on my site on weekends and tweet mid-week observations at @humblestudent. Subscribers will also receive email notices of any changes in my trading portfolio.
Trumponomics: The bear case
In last week's post (see How Trumponomics could push the SPX to 2500 and beyond), I laid out the bull case for stocks under a Trump administration and how stock prices could appreciate 20% in 2017, assuming everything goes right. This week, I outline the bear case, or how Trumponomics keeps me awake at night.
Candidate Trump has said many things on the campaign trail, some of which are contradictory. President-elect Trump's cabinet is taking shape and we are now getting some hints about policy direction. Nevertheless, there are a number of contradictions in his stated positions whose unexpected side-effects that could turn out to be equity bearish:
Legislative tax cut disappointment
A contradiction in fiscal policy vs. trade policy
Geopolitical friction with China
Rising geopolitical risk
Loss of market confidence
A possible collision course with the Federal Reserve
In this post, I will discuss each of these points, and I will end on how I believe these contradictions are likely to be resolved by the market.
Mid-week market update: As the Dow approaches the magic 20,000 mark, the question for traders is: Will Santa Claus be coming to town this year, or will the market advance stall as it catches "round number-itis"?
Preface: Explaining our market timing models
We maintain several market timing models, each with differing time horizons. The "Ultimate Market Timing Model" is a long-term market timing model based on the research outlined in our post, Building the ultimate market timing model. This model tends to generate only a handful of signals each decade.
The Trend Model is an asset allocation model which applies trend following principles based on the inputs of global stock and commodity price. This model has a shorter time horizon and tends to turn over about 4-6 times a year. In essence, it seeks to answer the question, "Is the trend in the global economy expansion (bullish) or contraction (bearish)?"
My inner trader uses the trading component of the Trend Model to look for changes in direction of the main Trend Model signal. A bullish Trend Model signal that gets less bullish is a trading "sell" signal. Conversely, a bearish Trend Model signal that gets less bearish is a trading "buy" signal. The history of actual out-of-sample (not backtested) signals of the trading model are shown by the arrows in the chart below. Past trading of the trading model has shown turnover rates of about 200% per month.
The latest signals of each model are as follows:
Ultimate market timing model: Buy equities*
Trend Model signal: Risk-on*
Trading model: Bullish*
The performance chart and model readings have been delayed by a week out of respect to our paying subscribers.
Update schedule: I generally update model readings on my site on weekends and tweet mid-week observations at @humblestudent. Subscribers will also receive email notices of any changes in my trading portfolio.
Trumponomics: The bull case
It's nearing year-end and prognostication season. Rather than just gaze into my crystal ball and make a forecast for 2017, I will write a two-part series on the likely effects of the new president on the stock market. This week, I focus on the bull case.
Since the recent upside breakout, point and figure charting is pointing to a SPX upside target of 2523, which represents a gain of 11.7% from Friday`s close. I show how that figure is easily achievable under the Trump proposals - and more.
In my post written last weekend (see Watch the reaction, not just the Fed), I suggested that the key to future stock market trajectory was not just the FOMC statement, but the reaction to the statement and subsequent press conference:
What happens to the dot plot?
How will the market react to the Fed's message? Will the current market expectations of about two more rate hikes in 2017 change?
How will Donald Trump react to the likely quarter-point rate hike?
I had expected a stand pat Summary of Economic Projections (SEP), otherwise known as the "dot plot". Instead, the FOMC shaded up the dot plot, which suggests that 2017 will see three quarter point rate hikes instead of two (chart via Business Insider).
The market reaction was understandably negative. Stock prices fell. Rates rose across the board, but the 2/10 yield curve steepened, which indicated market expectations of better growth.
Here is my perspective on the new dot plot and subsequent market reaction.
Further to my last post (see Watch the reaction, not just the Fed), I got a number of questions that asked if there are any factors or nuances from the FOMC statement or subsequent press conference to watch for.
Firstly, I reiterate my point that the reaction to the Fed is far more important to the future direction of stock prices than the Fed statement itself. I expect that the Fed will try very hard to remain apolitical and refuse to react to any possible changes in fiscal policy until they are actually announced. Nevertheless, I will be watching if the committee makes any references to:
The strength of the US Dollar; and
Any possible changes in the projected path of inflation.
How the Fed views these factors will influence affect the pace of interest rate normalization in 2017.
Preface: Explaining our market timing models
We maintain several market timing models, each with differing time horizons. The "Ultimate Market Timing Model" is a long-term market timing model based on the research outlined in our post, Building the ultimate market timing model. This model tends to generate only a handful of signals each decade.
The Trend Model is an asset allocation model which applies trend following principles based on the inputs of global stock and commodity price. This model has a shorter time horizon and tends to turn over about 4-6 times a year. In essence, it seeks to answer the question, "Is the trend in the global economy expansion (bullish) or contraction (bearish)?"
My inner trader uses the trading component of the Trend Model to look for changes in direction of the main Trend Model signal. A bullish Trend Model signal that gets less bullish is a trading "sell" signal. Conversely, a bearish Trend Model signal that gets less bearish is a trading "buy" signal. The history of actual out-of-sample (not backtested) signals of the trading model are shown by the arrows in the chart below. Past trading of the trading model has shown turnover rates of about 200% per month.
The latest signals of each model are as follows:
Ultimate market timing model: Buy equities*
Trend Model signal: Risk-on*
Trading model: Bullish*
The performance chart and model readings have been delayed by a week out of respect to our paying subscribers.
Update schedule: I generally update model readings on my site on weekends and tweet mid-week observations at @humblestudent. Subscribers will also receive email notices of any changes in my trading portfolio.
All eyes on the Fed
As market activity starts to wind down for the holiday season, the major event next week will be the FOMC meeting. The Fed's policy move has been well telegraphed and a quarter-point rate hike will be a foregone conclusion. Bond yields have been rising, and so have inflationary expectations, but that's not a surprise. Sometimes the best part of watching a play where you already know the plot is to watch the audience`s reaction.
Even as bond prices got clobbered, equities have soared. Major US indices achieved new record highs last week. At this rate, the SPX may achieve its point and figure target of over 2500 in the not too distant future.
To stay ahead of the markets, here is what I will be watching next week in the wake of the FOMC announcement:
What happens to the dot plot?
How will the market react to the Fed's message? Will the current market expectations of about two more rate hikes in 2017 change?
How will Donald Trump react to the likely quarter-point rate hike?
Mid-week market update: It was the best of times, it was the worst of times. Stock prices continue to surge ahead, while the bond market *ahem* is having its difficulties.
The Dow Jones Industrials Average made another record high, followed by the Transportation Average. The combination of the dual all-time highs constitutes a Dow Theory buy signal.
By contrast, investors are fleeing the bond market. Moreover, the yield curve is steepening, which means two things. First, long dated yields are rising higher than short yields, which means that investors at the long end of the maturity curve got hurt more. In addition, a steepening yield curve has historically been the bond market's signal of better growth expectations.
How are we to interpret these differing patterns in stocks and bonds? Have stocks gone too far? Are bonds ready for a comeback?
Dani Rodrik of Harvard University is the author of the best-known such critique. In the late 1990s he pointed out that deeper economic integration required harmonisation of laws and regulations across countries. Differences in rules on employment contracts or product-safety requirements, for instance, act as barriers to trade. Indeed, trade agreements like the Trans-Pacific Partnership focus more on “non-tariff barriers” than they do on tariff reduction. But the consequences often run counter to popular preferences: the French might find themselves barred from supporting a French-language film industry, for example.
Deeper integration, Mr Rodrik reckoned, will therefore lead either to an erosion of democracy, as national leaders disregard the will of the public, or will cause the dissolution of the nation state, as authority moves to supranational bodies elected to create harmonised rules for everyone to follow. These trade-offs create a “trilemma”, in Mr Rodrik’s view: societies cannot be globally integrated, completely sovereign and democratic—they can opt for only two of the three. In the late 1990s Mr Rodrik speculated that the sovereignty of nation states would be the item societies chose to discard. Yet it now seems that economic integration may be more vulnerable.
In practice, it is difficult to integrate global trade without the harmonization of standards and business practices. While that sounds fine in theory, here is an example of what happens when the rubber meets the road.
Preface: Explaining our market timing models
We maintain several market timing models, each with differing time horizons. The "Ultimate Market Timing Model" is a long-term market timing model based on the research outlined in our post, Building the ultimate market timing model. This model tends to generate only a handful of signals each decade.
The Trend Model is an asset allocation model which applies trend following principles based on the inputs of global stock and commodity price. This model has a shorter time horizon and tends to turn over about 4-6 times a year. In essence, it seeks to answer the question, "Is the trend in the global economy expansion (bullish) or contraction (bearish)?"
My inner trader uses the trading component of the Trend Model to look for changes in direction of the main Trend Model signal. A bullish Trend Model signal that gets less bullish is a trading "sell" signal. Conversely, a bearish Trend Model signal that gets less bearish is a trading "buy" signal. The history of actual out-of-sample (not backtested) signals of the trading model are shown by the arrows in the chart below. Past trading of the trading model has shown turnover rates of about 200% per month.
The latest signals of each model are as follows:
Ultimate market timing model: Buy equities*
Trend Model signal: Risk-on*
Trading model: Bearish*
The performance chart and model readings have been delayed by a week out of respect to our paying subscribers.
Update schedule: I generally update model readings on my site on weekends and tweet mid-week observations at @humblestudent. Subscribers will also receive email notices of any changes in my trading portfolio.
Remember the Audacity of Hope?
Does anyone remember Obama's "Audacity of Hope" campaign that won him the White House? As a reminder, here is a video clip from eight years ago which depicted an Obama supporter who believed that the new administration would pay for her gas and mortgage. Fast forward to today, Obama's legislative legacy is far less impressive than what his enthusiastic supporters expected from St. Barack of Chicago.
While the jury is still out on what the political expectations are for Donald Trump's win, market expectations are getting positively giddy, which may be setting itself up for disappointment. Here is what Ed Hyman of ISI Evercore observed from his survey of institutional clients:
Will the legacy of Trump's "Make America Great Again" be similar to Obama's "Audacity of Hope"? While it's far too early to make any kind of judgment, I made the point last week that the fundamentals for the current market rally have been in place before the election (see The start of a new Trump bull?), the electoral results seemed to have awakened the market`s animal spirits.
There is much to get enthusiastic about. Evidence of a reflationary turnaround had been brewing since the summer. Many of the stated business friendly policies of the Trump administration are also reasons to get bullish on stocks. However, excess bullishness can carry the risk of the bulls' demise. Jeffrey Gundlach recently warned that the rally was losing steam:
The strong U.S. stock market rally, surge in Treasury yields and strength in the U.S. dollar since Trump's surprising Nov. 8 presidential victory look to be "losing steam," Gundlach, who oversees more than $106 billion at the Los Angeles-based investment management firm, said in a telephone interview.
"The bar was so low on Trump to the point people were expecting markets will go down 80 percent and global depression - and now this guy is the Wizard of Oz and so expectations are high," Gundlach said. "There's no magic here."
Gundlach had warned last month that federal programs take time to implement, rising mortgage rates and monthly payments are not positive for the "psyche of the middle class and broadly," and supporters of defeated White House candidate Hillary Clinton are not in a mood to spend money.
"There is going to be a buyer's remorse period," said Gundlach, who voted for Trump and accurately predicted in January the winner of the presidential election.
Has Trump made stocks great again? Should you get cautious? Here is how I would play the market as I peer into 2017.
Announcing our Black Friday/Anniversary promotion!
We are making a limited number of discounted annual subscriptions available at a price of US$199.99, which is US$50 off the regular price of US$249.99, for the first year. This offer is open to the first 100 subscribers, or until December 15, 2016, whichever comes first. Click on this link to subscribe and use the code anniversary2016 at checkout to get the discount.
We only have a handful of discounted annuals subscriptions left. Hurry before they're all gone!
Mid-week market update: About two weeks ago, I wrote a post indicating that market had focused on the positives of a Trump presidency (see The Trump Presidency: A glass half-full?). Now it seems that market psychology is subtly shifting to a glass half-empty view.
It is very revealing when the new nominees for the key commerce ans treasury cabinet posts make market soothing noises and stock prices barely move. Josh Brown's reaction to Steven Mnuchin as the Secretary of the Treasury and Wilbur Ross as Secretary of Commerce is probably fairly typical of the market:
Good morning. Just wanted to check in briefly to voice my approval for the Treasury Secretary and Commerce Secretary picks announced by the Trump transition team this morning. They’re both highly accomplished and capable people who’ve held senior roles within businesses, even if they don’t have government experience.
To my knowledge, neither is looking to eject homosexuals, Jews or brown people from the country, so that’s a step in the right direction. I don’t believe that either has an agenda against women or takes money directly from Russian banks or posts frog memes on Twitter. Neither pick is a sitcom star from the 1980’s or one of the President-Elect’s children.
The hourly SPX chart below tells the story of a lack of positive reaction to good news. Such market reaction points to short-term bullish exhaustion.
Announcing our Black Friday/Anniversary promotion!
We are making a limited number of discounted annual subscriptions available at a price of US$199.99, which is US$50 off the regular price of US$249.99, for the first year. This offer is open to the first 100 subscribers, or until December 15, 2016, whichever comes first. Click on this link to subscribe and use the code anniversary2016 at checkout to get the discount.
We only have a handful of discounted annuals subscriptions left. Hurry before they're all gone!
It was nine years ago today, Humble Student of the Markets was born. My first post at the time was entitled What exactly are hedge funds hedging? I went on to show that hedge fund returns were correlated with equity returns. That makes conceptual sense, because hedge funds are in the business of taking risk and equity risk is a major component of investing risk.
HFs are so 20th century...
Nine years later, hedge funds have done even worse than what I showed in 2007. Charlie Bilello showed that their returns have flattened out. They are no longer correlated with equity returns.
It could be argued that HFs are absolute return vehicles and therefore it is unfair to compare them against equities. Bloomberg showed that their performance against a balanced fund benchmark has been nothing to write home about either.
The market has reacted and the latest figures show that YTD hedge fund fund flows have turned negative. YTD redemptions are 77b as of October 2016.
Alpha is hard to find
My assertion back in 2007 that alpha is hard to find turned out to be correct. Many HF strategies, such as convertible arbitrage, long/short equity, event-driven, emerging markets, and so on, can be approximated by combinations of factors. In other words, you were paying for beta when you thought you were buying alpha. Since then, even those beta strategies have turned into...I don't know what as aggregate HFRX Indices have flattened out over the last few years.
The field is getting far too crowded to extract significant alpha. Back in the early 1990's, when swashbuckling managers like Julian Robertson and George Soros dominated the field, a billion dollar hedge fund was an enormous fund. Today, a fund with AUM that size just gets lost in the crowd.
Adding value to the investment process
I am not always right, but this is just an example of the value I have brought to the blogosphere and to the investment community.
We announced the Black Friday/Anniversary promotion nine days ago. We only have a handful of discounted annual subscriptions left at a price of US$199.99, which is US$50 off the regular price of US$249.99, for the first year. This offer is open to the first 100 subscribers, or until December 15, 2016, whichever comes first. Click on this link to subscribe and use the code anniversary2016 at checkout to get the discount.
The stars seem to be aligning for a revival in gold prices. Prices saw a nice bounce today as equities weakened. The trends in other asset classes, such as stocks, bonds, and the US Dollar, look very stretched in the short-term and poised to reverse. From an inter-market analyst viewpoint, gold also seems to be in that camp.
The chart of gold below tells the story. Bullion prices have been falling and they are oversold on RSI-14. The violation of key support at the 1205-1210 zone has prompted high volume selling, which is indicative of investor capitulation. From a technical perspective, gold prices are now testing a Fibonacci retracement level at 1170.
This seems to be a classic setup for a revival in gold prices. Not so fast! While gold prices may stage an oversold rally here, a durable bottom may not be in place just yet.
Announcing our Black Friday/Anniversary promotion!
We are making a limited number of discounted annual subscriptions available at a price of US$199.99, which is US$50 off the regular price of US$249.99, for the first year. This offer is open to the first 100 subscribers, or until December 15, 2016, whichever comes first. Click on this link to subscribe and use the code anniversary2016 at checkout to get the discount.
Preface: Explaining our market timing models
We maintain several market timing models, each with differing time horizons. The "Ultimate Market Timing Model" is a long-term market timing model based on the research outlined in our post, Building the ultimate market timing model. This model tends to generate only a handful of signals each decade.
The Trend Model is an asset allocation model which applies trend following principles based on the inputs of global stock and commodity price. This model has a shorter time horizon and tends to turn over about 4-6 times a year. In essence, it seeks to answer the question, "Is the trend in the global economy expansion (bullish) or contraction (bearish)?"
My inner trader uses the trading component of the Trend Model to look for changes in direction of the main Trend Model signal. A bullish Trend Model signal that gets less bullish is a trading "sell" signal. Conversely, a bearish Trend Model signal that gets less bearish is a trading "buy" signal. The history of actual out-of-sample (not backtested) signals of the trading model are shown by the arrows in the chart below. Past trading of the trading model has shown turnover rates of about 200% per month.
The latest signals of each model are as follows:
Ultimate market timing model: Buy equities*
Trend Model signal: Risk-on*
Trading model: Bearish (downgrade)*
The performance chart and model readings have been delayed by a week out of respect to our paying subscribers.
Update schedule: I generally update model readings on my site on weekends and tweet mid-week observations at @humblestudent. Subscribers will also receive email notices of any changes in my trading portfolio.
Market is following my road map
Last week, perennially bullish strategist Tom Lee appeared on CNBC and stated that the Trump win could produce a major bull market. While it is true that stock prices have rallied significantly since the election, the fundamental underpinnings of the advance were not mainly attributable to Trump's win, notwithstanding the change in psychology.
Many of the reasons for the stock market gains were already baked in before the election. Consider, for example, the better growth outlook. The chart below shows the evolution of the NY Fed's nowcast of Q4 GDP growth, which shows an upward acceleration in Q4 growth. Those factors were already in place well before the election, regardless of who won the White House.
Announcing our Black Friday/Anniversary promotion!
We are making a limited number of discounted annual subscriptions available at a price of US$199.99, which is US$50 off the regular price of US$249.99, for the first year. This offer is open to the first 100 subscribers, or until December 15, 2016, whichever comes first. Click on this link to subscribe and use the code anniversary2016 at checkout to get the discount.
Mid-week market update: Traders who rely on technical signals use two main kinds of trading systems. They either rely on trends or counter-trend signals. Trending systems capitalizes on spotting a bandwagon and jumping on it before the crowd to ride it to profit. By contrast, counter-trends systems depend on finding market extremes and positioning for the pending reversal.
The market is currently strongly trending and staged important breakout to new highs. However, it is also stretched on a number of measures and this condition is occurring in a number of asset classes. An inter-market analysis suggests that the markets are poised to either pause or correct their strong moves.
Announcing our Black Friday/Anniversary promotion!
We are making a limited number of discounted annual subscriptions available at a price of US$199.99, which is US$50 off the regular price of US$249.99, for the first year. This offer is open to the first 100 subscribers, or until December 15, 2016, whichever comes first. Click on this link to subscribe and use the code anniversary2016 at checkout to get the discount.
Ian Bremmer of the Eurasia Group recently tweeted the following political calendar in Europe. After the surprising Trump win, the market is closely watching for electoral surprises. Next up is the Italian referendum on December 4, 2016, in which PM Matteo Renzi has asked for revisions to the constitution in order to break the endless cycle of deadlocked and changing governments. Italy has seen over 60 governments since the Second World War. Austria will also hold its presidential election on December 4, in which far-right candidate Norbert Hofer is leading in the polls. The results are mitigated by the largely ceremonial nature of the presidential post.
The Italian referendum and Austrian vote will be followed by an election in the Netherlands, in which anti-EU Freedom Party led by Geert Wilders is leading in the polls. The French presidential election will be held in the summer, where the anti-establishment candidate Marine Le Pen is expected to poll second heading into the run-off race. Finally, Germany will hold its election in late 2017.
Announcing our Black Friday/Anniversary promotion!
We are making a limited number of discounted annual subscriptions available at a price of US$199.99, which is US$50 off the regular price of US$249.99, for the first year. This offer is open to the first 100 subscribers, or until December 15, 2016, whichever comes first. Click on this link to subscribe and use the code anniversary2016 at checkout to get the discount.
Preface: Explaining our market timing models
We maintain several market timing models, each with differing time horizons. The "Ultimate Market Timing Model" is a long-term market timing model based on the research outlined in our post, Building the ultimate market timing model. This model tends to generate only a handful of signals each decade.
The Trend Model is an asset allocation model which applies trend following principles based on the inputs of global stock and commodity price. This model has a shorter time horizon and tends to turn over about 4-6 times a year. In essence, it seeks to answer the question, "Is the trend in the global economy expansion (bullish) or contraction (bearish)?"
My inner trader uses the trading component of the Trend Model to look for changes in direction of the main Trend Model signal. A bullish Trend Model signal that gets less bullish is a trading "sell" signal. Conversely, a bearish Trend Model signal that gets less bearish is a trading "buy" signal. The history of actual out-of-sample (not backtested) signals of the trading model are shown by the arrows in the chart below. Past trading of the trading model has shown turnover rates of about 200% per month.
The latest signals of each model are as follows:
Ultimate market timing model: Buy equities*
Trend Model signal: Risk-on*
Trading model: Bullish*
The performance chart and model readings have been delayed by a week out of respect to our paying subscribers.
Update schedule: I generally update model readings on my site on weekends and tweet mid-week observations at @humblestudent. Subscribers will also receive email notices of any changes in my trading portfolio.
Dark clouds on the horizon
Regular readers know that I have been bullish on stocks for much of this year, but I am now going on "recession watch". Josh Brown agrees. He tweeted the following last Thursday:
While Brown may have gone on "recession watch" for contrarian reasons, I am on "recession watch" because of a deterioration in macro data. But don't panic. A "recession watch" is emphatically not a forecast of an impending slowdown, nor is it a forecast of an imminent bear market. Macro readings are starting to look a little wobbly and therefore some caution may be warranted. The scenario that I outlined before of a cyclical top in 2017 is playing itself out (see Roadmap to a 2017 market top).
The chart below shows Goldman Sachs' depiction of US recession risk. While I don`t necessarily agree with Goldman`s probability estimates, I do agree that risks are rising but they are not at levels that warrant a full-scale defensive portfolio position (annotations in red are mine).
This week, I would like to expand on the threats that faces the US and global economies, and by implication the stock market. I would further point out that the data began to deteriorate before the election and my change in view has little to do with the electoral results. Only one of the Trump proposals have an unexpected side-effect of exacerbating the downside vulnerability of the global economy in a downturn, but that effect is relatively minor.
I have been seeing analysis from various quarters raising concerns about the sustainability of the post-election stock market advance because of the poor breadth of the market. The chart below shows the NYSE A-D Line overlaid on top of the SP 500. As you can see from the chart, the NYSE A-D Line has been lagging even as the market advanced. If the generals (large caps) are leading the charge, but the troops (breadth) are not following, then such divergences are thought to be warning signs that the move may not be sustainable.
I would not be so worried about that. The NYSE Composite is made up of many closed-end bond funds and REITs which have dragged down the performance of that index. We can see a hint of that effect in TRIN (top panel). There were two days in the post-election rally when TRIN fell below 0.50, which is an indication that advancing volume was running well ahead of advancing issues. That`s because many of the declining issues were relatively thinly traded interest sensitive bond funds and REITs.
While I am not worried about a negative breadth divergence, the sudden turnaround in bullish sentiment is a concern to me.
In many ways, Donald Trump is an economic enigma. Candidate Trump has in the past advocated wildly contradictory positions on the campaign trail. Sometime the market is left not knowing what to think.
One little discussed topic but important topic is Trump's relationship with the Federal Reserve. What kind of Fed would he like to see?
Candidate Trump assailed the Fed in September 2016 for keep rates too low (via Reuters):
Republican presidential nominee Donald Trump, who has previously accused the Federal Reserve of keeping interest rates low to help President Barack Obama, said on Monday that the U.S. central bank has created a “false economy” and that interest rates should change.
“They’re keeping the rates down so that everything else doesn’t go down,” Trump said in response to a reporter’s request to address a potential rate hike by the Federal Reserve in September. “We have a very false economy,” he said.
“At some point the rates are going to have to change,” Trump, who was campaigning in Ohio on Monday, added. “The only thing that is strong is the artificial stock market,” he said.
An easy monetary policy helped the incumbent party by stimulating growth. When he becomes President Trump in January, does he still want the Fed to take a more hawkish approach to monetary policy?
Preface: Explaining our market timing models
We maintain several market timing models, each with differing time horizons. The "Ultimate Market Timing Model" is a long-term market timing model based on the research outlined in our post, Building the ultimate market timing model. This model tends to generate only a handful of signals each decade.
The Trend Model is an asset allocation model which applies trend following principles based on the inputs of global stock and commodity price. This model has a shorter time horizon and tends to turn over about 4-6 times a year. In essence, it seeks to answer the question, "Is the trend in the global economy expansion (bullish) or contraction (bearish)?"
My inner trader uses the trading component of the Trend Model to look for changes in direction of the main Trend Model signal. A bullish Trend Model signal that gets less bullish is a trading "sell" signal. Conversely, a bearish Trend Model signal that gets less bearish is a trading "buy" signal. The history of actual out-of-sample (not backtested) signals of the trading model are shown by the arrows in the chart below. Past trading of the trading model has shown turnover rates of about 200% per month.
The latest signals of each model are as follows:
Ultimate market timing model: Buy equities*
Trend Model signal: Risk-on*
Trading model: Bullish*
The performance chart and model readings have been delayed by a week out of respect to our paying subscribers.
Update schedule: I generally update model readings on my site on weekends and tweet any changes during the week at @humblestudent. Subscribers will also receive email notices of any changes in my trading portfolio.
It would be too easy to get into an impotent rage should your favored candidate lose, or if policy doesn't go in your desired direction. That kind of thinking clouds judgment and leads to subpar investment results.
Stock prices are a function of earnings, the growth outlook, interest rates, and risk premium. There is much we don't know about policy details under a Trump administration, but the market's judgment of the election oscillated from unbridled panic on to euphoria in less than 24 hours. The fast money crowd jumped into the risk-on momentum trade last week. Based on historical studies, the rally has the legs to go much further. Here is a study from Nautilus Capital, which indicates that the returns after election day is indicative of momentum for the next 3-6 months (n=30):
Ned Davis Research also pointed out that the combination of a Republican president and Republican Congress have enjoyed the second best returns (caution, n=3):
The stock market embraced the reflation investment thesis that I have been writing about for several months, except this time it`s reflation on steroids (also see Super Tuesday special: How President Trump could spark a market blow-off). As there are many blanks that still to get filled in about the new administration, it's important to be aware of the bull case and bear case for stocks.
Mid-week market update: Today's market action should be a lesson to me to change model rankings based on overnight futures prices, which trades in a thin and volatile market (see What now?). To set the record straight, the Trend Model did not move to a neutral, or risk-off reading based on today's market action. The change last night was based on ES futures falling 3-4% at the time of writing.
One common refrain made by politicians who concede elections is, "The people have spoken!" In this case, the market has spoken and it has decided to adopt the bullish view that Trump is a reflationary president, rather than the bearish view of Trump the protectionist. This interpretation was made evident by the rally in the cyclically sensitive industrial metals, even as gold prices fell.
From a technical viewpoint, the stock market's behavior is showing a path to an uber-bullish outcome. As the chart below shows, the market is showing the combination of a fear unwind, indicated by the normalization of the VIX term structure from an inverted state, and two days where TRIN has dipped below 0.50, which is a signal of a buying stampede.
As I write these words, there is pandemonium in the markets. ES futures are down about 4%. My 16 year-old (Canadian) daughter received an offer of marriage over the internet from an American.
I recognize that a lot of people view a Trump presidency with horror, but it's time to assess the investment implications of these electoral results. Arguably, fear levels have already spiked and any panic selling could be viewed as a buying opportunity for stocks. As the chart below shows, the CBOE put/call ratio (middle panel) spiked to 1.48 yesterday and the VIX term structure inverted. These are readings consistent with short-term bottoms rather than the start of a sustained bear leg.
So let's take a deep breath and review the bull and bear case for equities under a Trump administration.
I got a few questions about an apparent contradiction in my last post (see Don't be fooled, Election 2016 isn't the Brexit referendum). I had highlighted a Mark Hulbert article indicating that former Value Line researcher director Sam Eisenstadt had a SPX target of 2270 to 2310 by April 2017.
At about the same time, Hulbert had also written a Barron's article on November 3, 2016 where he postulated little or no upside in stock prices, based on the analysis of the Value Line Median Appreciation Potential (VLMAP). In fact, VLMAP readings are similar to levels seen at the 2007 market top:
Market timers use the VLMAP to project where the stock market will be in four years, the midpoint of the analysts’ three-to-five-year horizon.
The VLMAP is currently at one of its lowest levels in years—as low, in fact, as it stood at the top of the bull market in October 2007, right before the worst bear market in the U.S. since the Great Depression.
Value Line itself does not recommend using the VLMAP as a market-timing tool, even though the firm is not against anyone using it or any of the other data it produces. As far as I can tell, the VLMAP-based market-timing model originates in work done in the 1970s and 1980s by Daniel Seiver, a member of the economics faculty at California Polytechnic State University and editor of an investment advisory service called the PAD System Report.
It’s worth noting that a casual reader of the Value Line Investment Survey wouldn’t immediately become alarmed upon viewing the latest VLMAP reading. It stands at 40%, which over four years is the equivalent to an annualized return of 8.8%.
As Eisenstadt had been the long serving research director of Value Line until 2009, how can investors reconcile these apparent contradictory bullish and bearish views based on similar data. Which interpretation of Value Line data should we believe?
Preface: Explaining our market timing models
We maintain several market timing models, each with differing time horizons. The "Ultimate Market Timing Model" is a long-term market timing model based on the research outlined in our post, Building the ultimate market timing model. This model tends to generate only a handful of signals each decade.
The Trend Model is an asset allocation model which applies trend following principles based on the inputs of global stock and commodity price. This model has a shorter time horizon and tends to turn over about 4-6 times a year. In essence, it seeks to answer the question, "Is the trend in the global economy expansion (bullish) or contraction (bearish)?"
My inner trader uses the trading component of the Trend Model to look for changes in direction of the main Trend Model signal. A bullish Trend Model signal that gets less bullish is a trading "sell" signal. Conversely, a bearish Trend Model signal that gets less bearish is a trading "buy" signal. The history of actual out-of-sample (not backtested) signals of the trading model are shown by the arrows in the chart below. Past trading of the trading model has shown turnover rates of about 200% per month.
The latest signals of each model are as follows:
Ultimate market timing model: Buy equities*
Trend Model signal: Risk-on*
Trading model: Bullish*
The performance chart and model readings have been delayed by a week out of respect to our paying subscribers.
Update schedule: I generally update model readings on my site on weekends and tweet any changes during the week at @humblestudent. Subscribers will also receive email notices of any changes in my trading portfolio.
It's all about the election
I have some terrible news to report. As a result of the change from Daylight Savings to Standard Time this weekend, the entire world will have to endure the US election for an extra hour.
All kidding aside, I could see the market anxiety rising all of last week. It wasn't just the market action, which had taken on an increasingly risk-off tone as the week went on. It wasn't the rising bearishness on social media. The biggest indicator of concerns over electoral uncertainty occurred when I saw that the traffic on my last post (see Trading the Trump Tantrum) was roughly triple the usual rate.
Despite some half-hearted rally attempts, the SPX ended the week testing its 200 day moving average (dma), and oversold on a number of key metrics. Traders are treating next week's US election as the same kind of market moving event as the Brexit referendum. There is one key difference. The market was relatively sanguine going into the UK vote and expected a favorable outcome. By contrast, the market is positioning for a bearish outcome, even though the polls show that the bullish scenario, namely a Clinton win, as the more likelyt scenario.
Market analysis in the face of event risk involves answering the following questions:
How would the market likely behave in the absence of tail-risk?
How are market participants positioned ahead of the event?
What are the likely bullish and bearish scenarios after the event?
Mid-week market update: The stock market sold off today on no apparent fundamental or economic news. The most likely cause was the latest ABC/Washington Post tracking poll that showed that Trump had overtaken Clinton. The race had been tightening for several days, but this seemed to be the last straw for the markets, which threw a tantrum in response.
The Mexican peso, which has been an excellent barometer of the presidential race, tanked as a result.
The stock market did too. The SPX has now broken a key support level at 2120 and I am seeing bearish technicians coming out of the woodwork in my social media feeds. The Fear and Greed Index is diving into fear territory.
Ever since Janet Yellen made that her "high pressured economy" speech, market analysts have been scrambling to understand what she meant by that term. The Fed Chair used that term in the context of a research conference held at the Boston Fed. So was it an academic musing, or was it a hint of a subtle shift in Fed policy?
The chart below shows the number of instances in the last 12 months when Core PCE has exceeded 2%, which is the Fed's inflation target. As the chart shows, the FOMC has tended to start a tightening cycle whenever the rolling count has hit six. The only exception occurred in 2011, when Europe mired in a Greek debt crisis.
The latest September Core PCE reading, which was released today, came in an annualized 1.7%, which was short of the 2% target. With the current count at five and therefore nearing the threshold for a tightening cycle, the question of the degree of tolerance for higher pressure in an economy is an important issue for monetary policy.
Preface: Explaining our market timing models
We maintain several market timing models, each with differing time horizons. The "Ultimate Market Timing Model" is a long-term market timing model based on the research outlined in our post, Building the ultimate market timing model. This model tends to generate only a handful of signals each decade.
The Trend Model is an asset allocation model which applies trend following principles based on the inputs of global stock and commodity price. This model has a shorter time horizon and tends to turn over about 4-6 times a year. In essence, it seeks to answer the question, "Is the trend in the global economy expansion (bullish) or contraction (bearish)?"
My inner trader uses the trading component of the Trend Model to look for changes in direction of the main Trend Model signal. A bullish Trend Model signal that gets less bullish is a trading "sell" signal. Conversely, a bearish Trend Model signal that gets less bearish is a trading "buy" signal. The history of actual out-of-sample (not backtested) signals of the trading model are shown by the arrows in the chart below. Past trading of the trading model has shown turnover rates of about 200% per month.
The latest signals of each model are as follows:
Ultimate market timing model: Buy equities*
Trend Model signal: Risk-on*
Trading model: Bullish*
The performance chart and model readings have been delayed by a week out of respect to our paying subscribers.
Update schedule: I generally update model readings on my site on weekends and tweet any changes during the week at @humblestudent. Subscribers will also receive email notices of any changes in my trading portfolio.
In the absence of political tail-risk...
Up until Friday, the big story of last week was the bond market's shellacking in the face of rising inflationary expectations. I had been planning to discuss whether the rout in bonds is likely to take down stock prices.
As the market has been trading sideways since the upside breakout in July, the question is whether this news is enough to signal the start of a bear phase (see my last post The bulls and bears wait for Godot). The bulls had been unable to push stock prices to new highs despite the emergence of renewed growth (see Q3 earnings season: Stud or dud?), can the bears take advantage of the news of a new FBI probe of Hillary Clinton`s email to weaken stock prices?
I begin this week's market analysis with an examination of the stock market's macro and fundamental backdrop. and then consider the ramifications of Friday's political bombshell.
Mid-week market update: Several readers wrote me this week with similar comments, which went something like, "I concur with your bullish fundamental reasoning, but the stock market is trading little 'heavy' and I am concerned." I agree 100%. Despite the bullish fundamental and technical tailwinds (see Six reasons why I am still bullish), the market hasn't been able to break out of the narrow range since the upside breakout in July to new all-time highs.
Ryan Detrick at LPL Financial characterized this market as a "historic holding pattern":
What has happened the past four months is truly historic, in that nothing has happened. For equities to trade in this tight of a range near all-time highs is extremely rare and we probably have the election to thank for it, as big money would rather wait until the results before making any moves.
From a technical viewpoint, neither the bulls nor the bears have been able to muster sufficient strength to break this market out of the narrow range. For both sides, they might have well been the characters Vladimir and Estragon in a production of Waiting for Godot. Nevertheless, there are plenty of reasons to be bullish on equities on an intermediate term basis.
As the American elections approach their final denouement in two weeks, it's time to look ahead to a number of political dark clouds forming in Europe. FT Alphaville recently highlighted research from Barclay's showing the collapse in support of establishment parties around the world.
The support for anti-establishment and protest parties and candidates have been on the rise - and these individuals represent threats to upset the current political status quo. After the US election in November, we have to look forward to the Italian referendum on December 4, the start of Brexit negotiations in early/mid 2017, the French election, and the German election. All of these events have the potential to tear Europe apart.
I believe that fears over the political disintegration in Europe may be overblown. Arguably, we could be seeing a near-term peak in the support of the protest vote in 2016 and 2017.
Preface: Explaining our market timing models
We maintain several market timing models, each with differing time horizons. The "Ultimate Market Timing Model" is a long-term market timing model based on the research outlined in our post, Building the ultimate market timing model. This model tends to generate only a handful of signals each decade.
The Trend Model is an asset allocation model which applies trend following principles based on the inputs of global stock and commodity price. This model has a shorter time horizon and tends to turn over about 4-6 times a year. In essence, it seeks to answer the question, "Is the trend in the global economy expansion (bullish) or contraction (bearish)?"
My inner trader uses the trading component of the Trend Model to look for changes in direction of the main Trend Model signal. A bullish Trend Model signal that gets less bullish is a trading "sell" signal. Conversely, a bearish Trend Model signal that gets less bearish is a trading "buy" signal. The history of actual out-of-sample (not backtested) signals of the trading model are shown by the arrows in the chart below. Past trading of the trading model has shown turnover rates of about 200% per month.
The latest signals of each model are as follows:
Ultimate market timing model: Buy equities*
Trend Model signal: Risk-on*
Trading model: Bullish*
The performance chart and model readings have been delayed by a week out of respect to our paying subscribers.
Update schedule: I generally update model readings on my site on weekends and tweet any changes during the week at @humblestudent. Subscribers will also receive email notices of any changes in my trading portfolio.
How will the Fed fight the next war?
In my last post (see A sentimental embrace of risk), I showed that risk appetite was starting to perk up. Investor interest is rising in both the reflation and cyclical investment themes. So far, this risk-on thesis is showing solid fundamental underpinnings.
The bearish strategists at Goldman Sachs and HSBC who had forecasted a disappointing Q3 earnings season have so far been wrong (see Q3 earnings season: Stud or dud?). With 23% of SPX companies having reported earnings, John Butters of Factset observed that both the EPS and sales beat are well above their 5-year historical averages. As a result, Street optimism continues to improve as forward 12-month EPS rose another 0.16% in the week (chart annotations are mine).
The stock market is on pace to rally on the back of a growth revival and the end of the earnings recession that began in late 2014. This party is just starting to going. The only question is when the Fed will act to take away the punch bowl. This issue is becoming a crucial question for investors, as speeches from Yellen and Fischer last week may indicate that the Fed is signaling the start of a shift in thinking of how it fights the next war, persistent low growth.
Welcome to my blog Humble Student of the Markets. These are my observations and musings about the markets (mostly equities), hedge funds and investments in general.My experience has been a quantitative equity manager in US, Canada, EAFE and Emerging Markets and commentator on hedge funds and their returns patterns.
DISCLAIMER This is not investment advice! I know nothing about you, your risk preferences, your portfolio or your investment horizon. I have no idea whether any of my opinions expressed are suitable for you.
None of the information or opinions expressed in this blog constitutes a solicitation for the purchase or sale of any security or other instrument. Nothing in this blog constitutes investment advice and any recommendations that may be contained herein have not been based upon a consideration of the investment objectives, financial situation or particular needs of any specific recipient. Any purchase or sale activity in any securities or other instrument should be based upon your own analysis and conclusions. Past performance is not indicative of future results. I may hold or control long or short positions in the securities or instruments mentioned.